
2026-07-20 · NoVo Analyst
NoVo Analyst · Pre-Market Primer
Structural Bias · BULLISH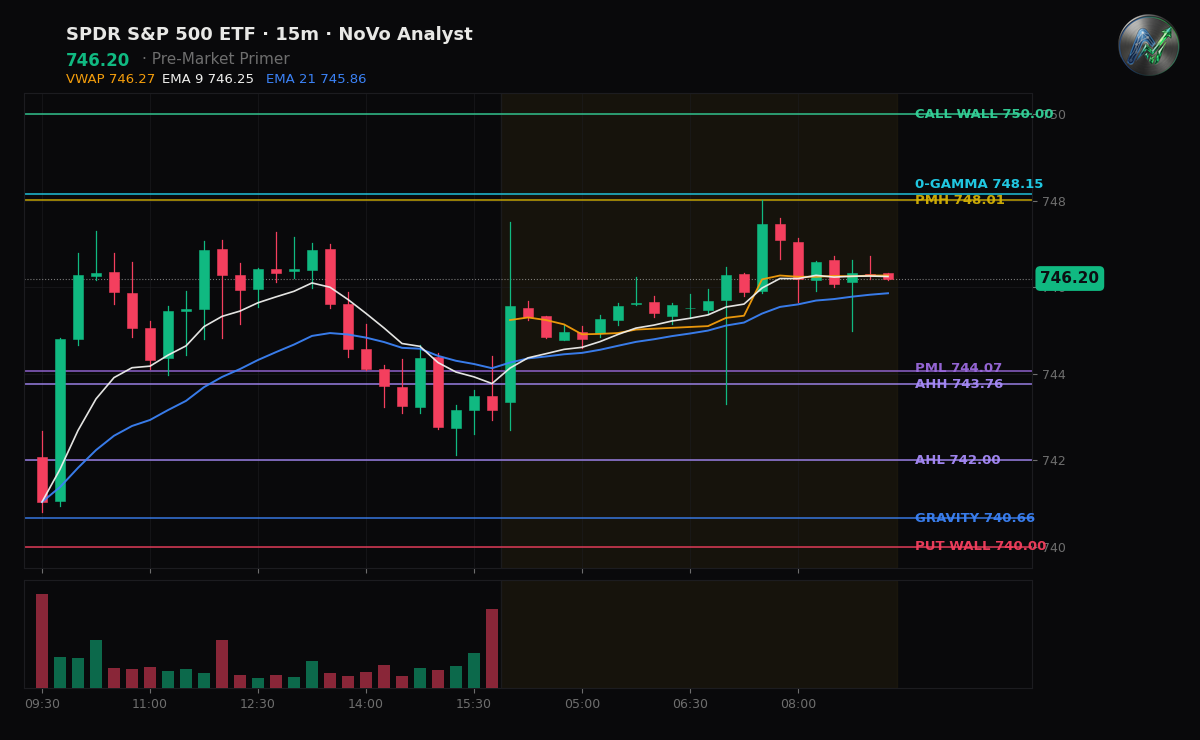
BOTTOM LINE: SPY enters the session with a tactical bullish bias following an overnight recovery, but remains capped beneath key structural inflection points where negative dealer gamma is primed to expand volatility.
THE SETUP
The index is gapping up 0.39% pre-market, trading near $746.20 after finding strong responsive buying at the overnight low of $742.00. The broader tone is dictated by rising geopolitical risk as a ninth consecutive night of U.S. airstrikes on Iran has pushed Brent crude back above $90 a barrel, introducing energy-driven inflation risks. Equity markets are simultaneously navigating a persistent unwind of crowded AI technology positions ahead of mid-week megacap earnings. While the pre-market drift shows buyer defense, the lack of major U.S. macroeconomic data today means price action will likely be driven by technical structure and shifting options-hedging flows.
DEALER POSITIONING
The options market is operating in a negative gamma regime with net GEX estimated at -$2.2B, a positioning profile where market makers must sell into weakness and buy into strength, actively amplifying intraday moves. This volatility-expanding posture is anchored beneath the Zero-Gamma flip level of $748.15, meaning any trading below this threshold subjects the tape to rapid, gapping directional shifts. The broader options book is net-short delta, carrying a heavily put-skewed volatility posture where puts remain highly bid relative to calls due to elevated downside hedging demand.
LEVELS TO WATCH
The critical near-term structural pivot is $748.15. Reclaiming and holding above this level neutralizes the active dealer short-gamma regime, forcing market makers to buy back short hedges and shifting the tactical bias toward afternoon resistance at $750.00. Conversely, if price fails to clear $748.15, the bearish posture remains intact, leaving the index vulnerable to a swift reversal. A breakdown below the pre-market low of $744.07 triggers an acceleration of the downward trend, exposing the market to a test of the major put wall and gravity magnet at $740.00, with intermediate structural support resting at $742.00.
DEALER POSITIONING MAP · SPY / QQQ / SPX
Vol environment: VIX 18.1 — 65th percentile of the past year (normal vol).
SPY $746.21
Net GEX: -$2.2B · negative — dealers amplify moves (moves extend)
Gamma Flip: $748.15
Gravity (magnet): $740.66
Call Wall: $750.00 Put Wall: $740.00
Expected move: ±$4.80 (±0.6%) today · ±$19.04 (±2.5%) this week
Put/Call skew: +3.9 vol pts · puts bid — downside hedging demand
MM skew · 0DTE +3.9 / next +4.6 vol pts · 0DTE complacency vs the next expiry
ATM IV: 10.2%
QQQ $701.74
Net GEX: -$333M · negative — dealers amplify moves (moves extend)
Gamma Flip: $703.09
Gravity (magnet): $694.21
Call Wall: $710.00 Put Wall: $690.00
Expected move: ±$7.49 (±1.1%) today · ±$28.70 (±4.1%) this week
Put/Call skew: +5.1 vol pts · puts bid — downside hedging demand
MM skew · 0DTE +5.1 / next +6.7 vol pts · 0DTE complacency vs the next expiry
ATM IV: 16.9%
SPX $7,452.52
Net GEX: -$9.5B · negative — dealers amplify moves (moves extend)
Gamma Flip: $7,466.52
Gravity (magnet): $7,421.19
Call Wall: $7,555.00 Put Wall: $7,400.00
Expected move: ±$50.21 (±0.7%) today · ±$190.11 (±2.5%) this week
Put/Call skew: +2.5 vol pts · puts bid — downside hedging demand
MM skew · 0DTE +2.5 / next +3.4 vol pts · 0DTE complacency vs the next expiry
ATM IV: 10.7%
Gamma Flip = where dealer hedging flips from dampening to amplifying moves. Call/Put Walls = the largest call/put gamma strikes (pin / resistance above, support below). Expected move = the ±1σ range priced into at-the-money options. Public options data — analysis, not signals.
FLOW DYNAMICS
Charm — in a negative-gamma regime, decay doesn't pin; moves can extend into the close. Vanna — with dealers short gamma, a drop in vol would ease the amplification and let the tape settle. Second-order dealer flow — context, not a signal.
Key Levels
This read landed hours ago for subscribers.
The Open, The Close, and The Week Ahead hit your inbox before the bell — plus real-time ‘The Line’ level-break alerts in Discord.
Start a 7-day free trial →