
2026-07-16 · NoVo Analyst
NoVo Analyst · Pre-Market Primer
Structural Bias · BEARISH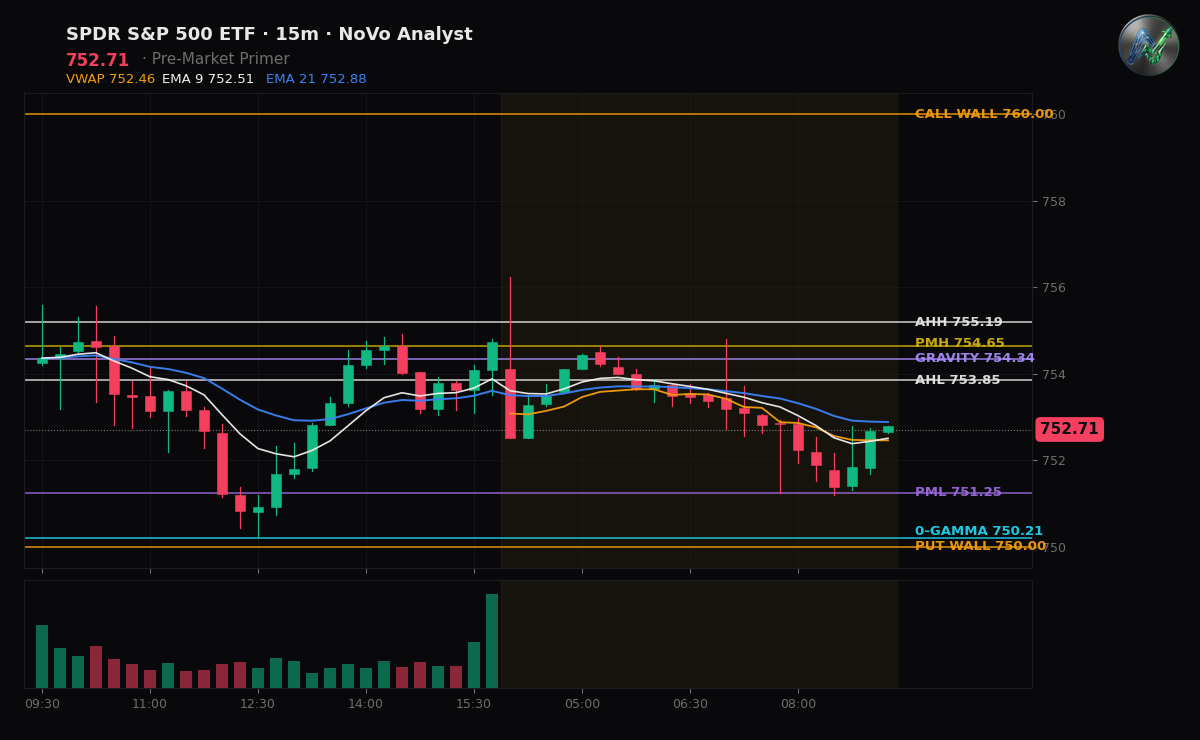
BOTTOM LINE: The SPY enters the cash open with a tactical bearish bias as overnight index futures bleed lower, setting up an active test of key downside liquidity pools.
THE SETUP
The overnight session established a clear downward trend, with S&P 500 futures consistently rejecting the session volume-weighted average price (VWAP) and breaking below key support levels. This pre-market weakness comes amid a heavy slate of domestic economic data. U.S. retail sales for June rose by a moderate 0.2% month-over-month to $768.6 billion, confirming a stable but cooling consumer engine, while weekly jobless claims unexpectedly fell by 8,000 to 208,000, and the Philadelphia Fed Manufacturing Index surged to 41.4. This combination of steady demand, a highly resilient labor market, and robust regional factory expansion keeps the economic baseline firm, but the immediate tape remains technically weak as the cash market prepares to absorb the pre-market gap down.
DEALER POSITIONING
The options market is operating in a supportive positive gamma regime, with net GEX calculated at +$2.7B. In this structural layout, market makers mechanically buy intraday weakness and sell strength, which dampens overall volatility and acts as a buffer to encourage mean reversion toward the gravity magnet of $754.34. The critical structural pivot is the Zero-Gamma flip level at $750.21; as long as price remains above this threshold, dealer positioning will actively insulate the tape against runaway downside moves. Under the hood, the standing options book maintains a net-long delta posture, though the put/call skew reflects active demand for downside protection as near-term hedging remains bid.
LEVELS TO WATCH
For sellers to expand this pre-market decline, they must reject any minor counter-trend bounces below the pre-market high of $754.65 and drive price through the pre-market low of $751.25. A sustained break below $751.25 opens a direct path toward the major put wall and Zero-Gamma flip level at $750.21, where dealer hedging behavior would shift from dampening to actively accelerating downside market moves. Conversely, if buyers reclaim the gravity magnet of $754.34 and establish price acceptance above yesterday's high of $755.58, it will neutralize the immediate bearish trend and allow for a potential run toward the after-hours high of $755.19 and higher-tier resistance at $757.00.
DEALER POSITIONING MAP · SPY / QQQ / SPX
Vol environment: VIX 16.3 — 31th percentile of the past year (low vol).
SPY $752.80
Net GEX: +$2.7B · positive — dealers dampen moves (grind / mean-revert)
Zero-Gamma (flip): $750.21
Gravity (magnet): $754.34
Call Wall: $760.00 Put Wall: $750.00
Expected move: ±$5.34 (±0.7%) today · ±$17.27 (±2.3%) this week
Put/Call skew: +3.0 vol pts · puts bid — downside hedging demand
MM skew · fast +3.0 / slow +3.0 vol pts · term structure flat
ATM IV: 11.3%
QQQ $711.67
Net GEX: -$756M · negative — dealers amplify moves (moves extend)
Zero-Gamma (flip): $713.31
Gravity (magnet): $713.69
Call Wall: $725.00 Put Wall: $700.00
Expected move: ±$12.11 (±1.7%) today · ±$27.09 (±3.8%) this week
Put/Call skew: +7.2 vol pts · puts bid — downside hedging demand
MM skew · fast +7.2 / slow +5.4 vol pts · near-term fear building vs the baseline
ATM IV: 27.0%
SPX $7,566.45
Net GEX: +$10.6B · positive — dealers dampen moves (grind / mean-revert)
Zero-Gamma (flip): $7,553.05
Gravity (magnet): $7,558.65
Call Wall: $7,600.00 Put Wall: $7,520.00
Expected move: ±$50.93 (±0.7%) today · ±$173.62 (±2.3%) this week
Put/Call skew: +2.6 vol pts · puts bid — downside hedging demand
MM skew · fast +2.6 / slow +3.1 vol pts · near-term complacency vs the baseline
ATM IV: 10.7%
Zero-Gamma = where dealer hedging flips from dampening to amplifying moves. Call/Put Walls = the largest call/put gamma strikes (pin / resistance above, support below). Expected move = the ±1σ range priced into at-the-money options. Public options data — analysis, not signals.
FLOW DYNAMICS
Charm — as today's options decay, dealer delta drifts toward the walls: a mild pull into the close (the pin). Vanna — a further rise in vol would erode the dealers' long-gamma cushion and add hedging pressure. Second-order dealer flow — context, not a signal.
Key Levels
This read landed hours ago for subscribers.
The Open, The Close, and The Week Ahead hit your inbox before the bell — plus real-time ‘The Line’ level-break alerts in Discord.
Start a 7-day free trial →