
2026-07-13 · NoVo Analyst
NoVo Analyst · Pre-Market Primer
Structural Bias · BEARISH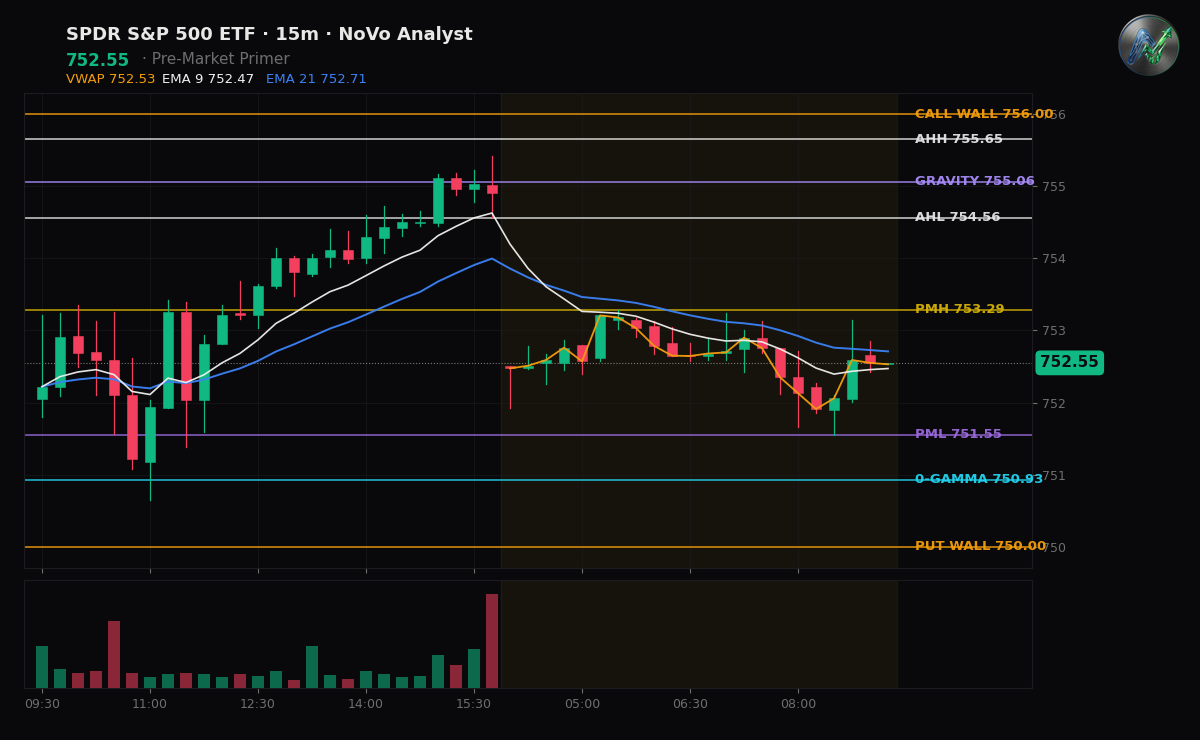
BOTTOM LINE: The SPY enters the session with a defensive, bearish bias as pre-market trading gaps down -0.33% to $752.55, driven by geopolitical energy shocks that threaten to disrupt the low-volatility regime.
THE SETUP
Overnight trading carried a persistent downward drift as escalating military exchanges between the U.S. and Iran in the Persian Gulf drove Brent crude prices toward $78 a barrel. This sudden energy-driven inflation shock introduces immediate overhead friction just ahead of Tuesday's June Consumer Price Index (CPI) print and Fed Chair Kevin Warsh's inaugural semi-annual congressional testimony. Given this tense macro backdrop, market participants are adopting a risk-off posture, preparing for structural volatility expansion after a prolonged period of suppressed daily ranges.
DEALER POSITIONING
The options market is starting the week with a net GEX of +$2.0B, establishing a positive gamma regime that would normally act to dampen overall market movement. However, the critical gamma-flip level sits at $752.48, meaning the index is opening directly on the edge of this transition point. If sellers break and hold price below $752.48, dealers will flip from buying dips to selling into weakness, a mechanical shift that amplifies downward momentum. Underneath the surface, the options book maintains a net-long delta tilt of approximately +18.0M delta-equivalents, carrying a daily theta decay headwind of $199.2M and a call-skewed volatility posture (+0.4M vega per vol-point) that remains vulnerable to a sharp spike in the VIX.
LEVELS TO WATCH
For the bullish intraday thesis to regain traction, buyers must immediately reclaim the pre-market high of $753.29, which would signal responsive demand and target a move back toward the key resistance level at $755.00. Conversely, a sustained break below the pre-market low of $751.55 confirms the bearish gap-and-go posture. Acceptance below $751.55 exposes the next major structural support level at the prior day's low of $748.10, which represents the final line of defense before a deeper liquidation event.
DEALER POSITIONING MAP · SPY / QQQ / SPX
Vol environment: VIX 16.4 — 34th percentile of the past year (low vol).
SPY $752.47
Net GEX: +$3.2B · positive — dealers dampen moves (grind / mean-revert)
Zero-Gamma (flip): $750.93
Gravity (magnet): $755.06
Call Wall: $756.00 Put Wall: $750.00
Expected move: ±$3.35 (±0.4%) today · ±$17.34 (±2.3%) this week
Put/Call skew: +2.0 vol pts · puts bid — downside hedging demand
MM skew · fast +2.0 / slow +2.1 vol pts · term structure flat
ATM IV: 7.1%
QQQ $718.00
Net GEX: +$36M · positive — dealers dampen moves (grind / mean-revert)
Zero-Gamma (flip): $717.87
Gravity (magnet): $722.84
Call Wall: $733.00 Put Wall: $716.00
Expected move: ±$7.25 (±1.0%) today · ±$25.17 (±3.5%) this week
Put/Call skew: +3.5 vol pts · puts bid — downside hedging demand
MM skew · fast +3.5 / slow +4.6 vol pts · near-term complacency vs the baseline
ATM IV: 16.0%
SPX $7,569.69
Net GEX: +$13.9B · positive — dealers dampen moves (grind / mean-revert)
Zero-Gamma (flip): $7,557.40
Gravity (magnet): $7,570.51
Call Wall: $7,575.00 Put Wall: $7,500.00
Expected move: ±$29.83 (±0.4%) today · ±$174.44 (±2.3%) this week
Put/Call skew: +1.7 vol pts · puts bid — downside hedging demand
MM skew · fast +1.7 / slow +2.0 vol pts · near-term complacency vs the baseline
ATM IV: 6.3%
Zero-Gamma = where dealer hedging flips from dampening to amplifying moves. Call/Put Walls = the largest call/put gamma strikes (pin / resistance above, support below). Expected move = the ±1σ range priced into at-the-money options. Public options data — analysis, not signals.
FLOW DYNAMICS
Charm — as today's options decay, dealer delta drifts toward the walls: a mild pull into the close (the pin). Vanna — a further rise in vol would erode the dealers' long-gamma cushion and add hedging pressure. Second-order dealer flow — context, not a signal.
Key Levels
This read landed hours ago for subscribers.
The Open, The Close, and The Week Ahead hit your inbox before the bell — plus real-time ‘The Line’ level-break alerts in Discord.
Start a 7-day free trial →