
2026-07-13 · NoVo Analyst
NoVo Analyst · Closing Bell Synopsis
Structural Bias · BEARISH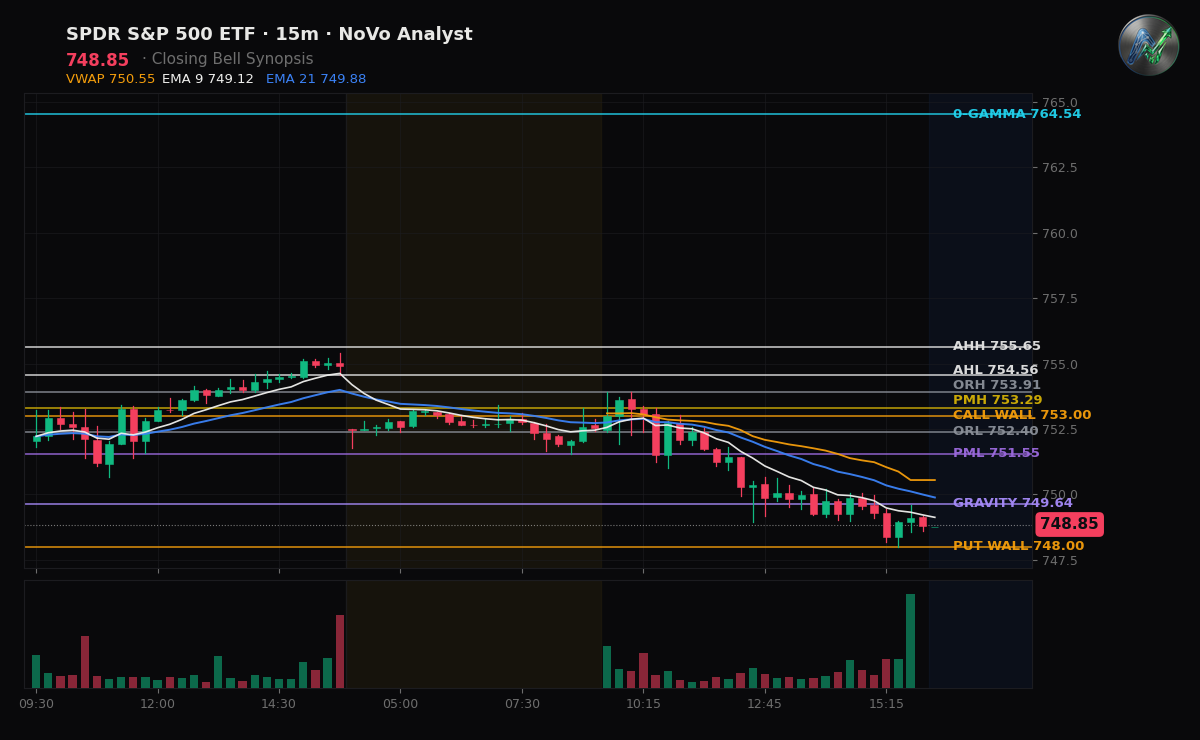
BOTTOM LINE: Sellers dominated the session as geopolitical escalation in the Strait of Hormuz drove oil prices higher, breaking the positive gamma regime and shifting control to dealers who are now structurally positioned to amplify further downside volatility.
THE RECAP
The SPY closed at $748.85, down 0.82% on the session and finishing below the day's volume-weighted average price (VWAP) as well as the opening range breakdown level of $752.40. This downward expansion was triggered by a sudden escalation in the Middle East, driving Brent crude toward $79 a barrel and introducing immediate stagflationary friction ahead of critical macro catalysts. The index spent the session in a persistent, trending decline, ultimately slicing through the previous day's low of $748.10 before finding a late-day bid.
DEALER POSITIONING
The options market has officially transitioned into a negative gamma regime, with net GEX finishing at -$0.4B. Because the index closed below the Zero-Gamma flip level of $749.93, market makers must now sell into market weakness and buy into strength to maintain balanced books—a mechanical dynamic that expands intraday price swings. This posture is reinforced by a net-short delta exposure of approximately -6.4M delta-equivalents in the standing options book, which faces a daily theta decay headwind of $58.5M and a put-skewed volatility posture of -0.2M vega per vol-point, leaving the market highly vulnerable to further downside hedging demand.
TOMORROW'S SETUP
For sellers to maintain their structural control, they must reject any early bounces and keep price accepted below the Zero-Gamma flip level of $749.93. Continued acceptance below this threshold exposes the major psychological put wall at $745.00, which represents the primary line of structural support before a deeper liquidation. Conversely, if buyers can reclaim $749.93, it will neutralize the negative dealer hedging pressure; a further push back above the opening range breakdown level of $752.40 is required to shift the intraday bias to neutral and target resistance at $753.29 and $753.91.
DEALER POSITIONING MAP · SPY / QQQ / SPX
Vol environment: VIX 17.1 — 50th percentile of the past year (normal vol).
SPY $748.74
Net GEX: -$537M · negative — dealers amplify moves (moves extend)
Zero-Gamma (flip): $749.93
Gravity (magnet): $748.59
Call Wall: $757.00 Put Wall: $745.00
Expected move: ±$7.75 (±1.0%) today · ±$17.98 (±2.4%) this week
Put/Call skew: +4.1 vol pts · puts bid — downside hedging demand
MM skew · fast +4.1 / slow +3.4 vol pts · near-term fear building vs the baseline
ATM IV: 16.4%
QQQ $711.54
Net GEX: -$552M · negative — dealers amplify moves (moves extend)
Zero-Gamma (flip): $719.84
Gravity (magnet): $710.74
Call Wall: $725.00 Put Wall: $705.00
Expected move: ±$12.50 (±1.8%) today · ±$27.94 (±3.9%) this week
Put/Call skew: +7.5 vol pts · puts bid — downside hedging demand
MM skew · fast +7.5 / slow +6.4 vol pts · near-term fear building vs the baseline
ATM IV: 27.9%
SPX $7,509.16
Net GEX: -$2.2B · negative — dealers amplify moves (moves extend)
Zero-Gamma (flip): $7,519.77
Gravity (magnet): $7,510.80
Call Wall: $7,575.00 Put Wall: $7,475.00
Expected move: ±$78.69 (±1.1%) today · ±$180.34 (±2.4%) this week
Put/Call skew: +3.3 vol pts · puts bid — downside hedging demand
MM skew · fast +3.3 / slow +3.5 vol pts · term structure flat
ATM IV: 16.6%
Zero-Gamma = where dealer hedging flips from dampening to amplifying moves. Call/Put Walls = the largest call/put gamma strikes (pin / resistance above, support below). Expected move = the ±1σ range priced into at-the-money options. Public options data — analysis, not signals.
FLOW DYNAMICS
Charm — in a negative-gamma regime, decay doesn't pin; moves can extend into the close. Vanna — with dealers short gamma, a drop in vol would ease the amplification and let the tape settle. Second-order dealer flow — context, not a signal.
Key Levels
This read landed hours ago for subscribers.
The Open, The Close, and The Week Ahead hit your inbox before the bell — plus real-time ‘The Line’ level-break alerts in Discord.
Start a 7-day free trial →