
2026-07-12 · NoVo Analyst
NoVo · The Week Ahead
Structural Bias · BULLISH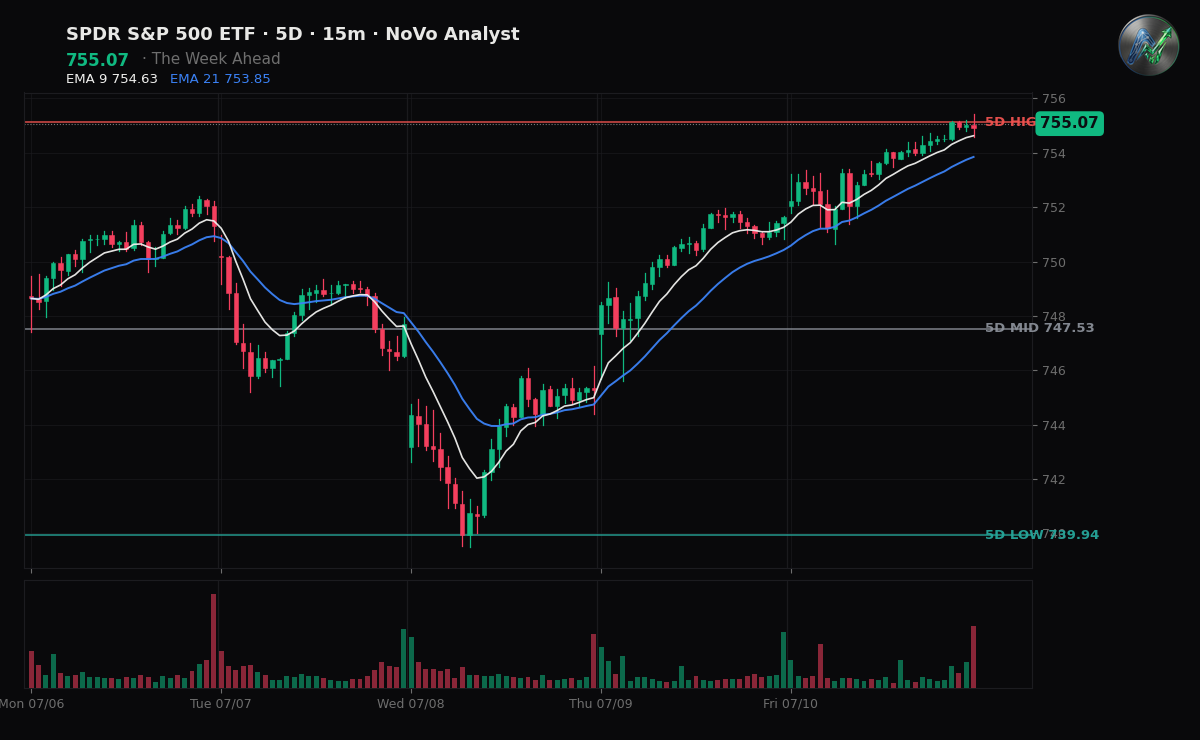
BOTTOM LINE: The SPY enters a highly volatile, data-heavy week locked in a bullish consolidation near historical highs, where the primary focus is whether upcoming inflation prints and central bank testimony can spark a clean breakout above the $755.00 resistance.
THE WEEK AHEAD
The SPY closed Friday at $755.07, capping off a constructive five-session stretch where the index gained 0.5% and finished at the absolute top of its weekly range. This grinding upward momentum has established a clear short-term bullish trend on the hourly and daily charts, with the index consolidating tightly near its recent highs. For options traders, this tight compression directly below major overhead resistance indicates a volatility squeeze is underway. The structural health of this trend will be tested immediately; a failure to hold the prior week's breakout levels would signal exhaustion, while a clean push through the upper boundary would open the door for a rapid extension into unchartered territory.
CATALYSTS
This week's calendar presents an exceptionally dense concentration of top-tier macro and corporate events that will dictate the market's direction. On Monday, Federal Reserve Governor Christopher Waller speaks, setting the tone ahead of Tuesday's critical dual-threat of June Consumer Price Index (CPI) inflation data and Fed Chair Kevin Warsh's first Humphrey-Hawkins testimony before the House Financial Services Committee. This testimony marks Warsh's first formal congressional appearance on monetary policy since taking office, with participants parsing his words for rate-path clues after the Fed recently held rates steady at 3.50% to 3.75%. Tuesday also kicks off Q2 earnings season with major financial institutions, including JPMorgan Chase, Bank of America, Goldman Sachs, and Citigroup, reporting before the bell. On Wednesday, the focus shifts to June Producer Price Index (PPI) inflation, alongside the NY Fed Empire State Manufacturing Index and Warsh's second day of testimony, this time before the Senate Banking Committee. Thursday brings June Retail Sales and weekly jobless claims, alongside corporate earnings from TSMC and Netflix, before Friday rounds out the week with June Industrial Production and the University of Michigan Consumer Sentiment index.
SCENARIOS
The options market is pricing in an elevated weekly expected move, establishing a broad tactical playing field bounded by key structural levels.
* **The Bull Case (Breakout Expansion):** If Tuesday's CPI print shows cooling inflation and Fed Chair Warsh maintains a balanced, data-dependent tone, buyers are highly likely to force a sustained break above immediate resistance at $755.42 and the after-hours high of $755.65. Successful acceptance above $755.65 triggers a squeeze, targeting an expansion toward $760.00.
* **The Base Case (Range-Bound Consolidation):** If the macro data and corporate earnings present a mixed picture without a clear directional catalyst, the SPY is expected to churn within its established weekly range. In this scenario, price continuously tests the upper resistance band near $755.00 while finding reliable structural support at the prior day's low of $748.10.
* **The Bear Case (Failed Breakout & Liquidation):** If inflation prints hotter than projected or Warsh strikes an aggressively hawkish tone that threatens the rate outlook, a rapid reversal is likely. A clean break below the critical weekly pivot at $748.10 invalidates the short-term bullish bias, exposing deeper structural support levels down at $744.60 and $742.10.
DEALER POSITIONING MAP · SPY / QQQ / SPX
Vol environment: VIX 15.0 — 11th percentile of the past year (very low vol).
SPY $755.07
Net GEX: +$2.0B · positive — dealers dampen moves (grind / mean-revert)
Zero-Gamma (flip): $752.48
Call Wall: $759.00 Put Wall: $740.00
Expected move (this week): ±$7.60 (±1.0%)
Put/Call skew: +2.1 vol pts · puts bid — downside hedging demand
ATM IV: 7.1%
QQQ $726.36
Net GEX: +$23M · positive — dealers dampen moves (grind / mean-revert)
Zero-Gamma (flip): $726.19
Call Wall: $735.00 Put Wall: $716.00
Expected move (this week): ±$14.51 (±2.0%)
Put/Call skew: +4.6 vol pts · puts bid — downside hedging demand
ATM IV: 14.2%
SPX $7,569.69
Net GEX: +$14.2B · positive — dealers dampen moves (grind / mean-revert)
Zero-Gamma (flip): $7,541.84
Call Wall: $7,575.00 Put Wall: $7,500.00
Expected move (this week): ±$76.74 (±1.0%)
Put/Call skew: +2.0 vol pts · puts bid — downside hedging demand
ATM IV: 7.2%
Zero-Gamma = where dealer hedging flips from dampening to amplifying moves. Call/Put Walls = the largest call/put gamma strikes (pin / resistance above, support below). Expected move = the ±1σ range priced into at-the-money options. Public options data — analysis, not signals.
FLOW DYNAMICS
Charm — as today's options decay, dealer delta drifts toward the walls: a mild pull into the close (the pin). Vanna — vol is low and dealers are long gamma; a VIX spike would flip them toward selling into weakness (amplifying) — the risk that changes the map. Second-order dealer flow — context, not a signal.
This read landed hours ago for subscribers.
The Open, The Close, and The Week Ahead hit your inbox before the bell — plus real-time ‘The Line’ level-break alerts in Discord.
Start a 7-day free trial →